1. Passage Reading
2. Verbal Logic
3. Non Verbal Logic
4. Numerical Logic
5. Data Interpretation
6. Reasoning
7. Analytical Ability
8. Quantitative Aptitude
(a) 2:3
| |
(b) 3:5
| |
(c) 4:5
| |
(d) 7:9
|
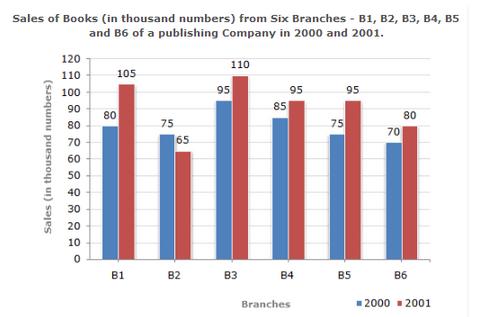
313. Total sales of branch B6 for both the years is what percent of the total sales of branches B3 for both the years?
(a) 68.54%
| |
(b) 71.11%
| |
(c) 73.17%
| |
(d) 75.55%
|
314. What percent of the average sales of branches B1, B2 and B3 in 2001 is the average sales of branches B1, B3 and B6 in 2000?
(a) 75%
| |
(b) 77.5%
| |
(c) 82.5%
| |
(d) 87.5%
|
315. What is the average sales of all the branches (in thousand numbers) for the year 2000?
(a) 73
| |
(b) 80
| |
(c) 83
| |
(d) 88
|
316. Total sales of branches B1, B3 and B5 together for both the years (in thousand numbers) is?
(a) 250
| |
(b) 310
| |
(c) 435
| |
(d) 560
|
TOTAL
Detailed Solution| 1 | 2 | 3 | 4 | 5 | 6 | 7 | 8 | 9 | 10 | 11 | 12 | 13 | 14 | 15 | 16 | 17 | 18 | 19 | 20 |
| 21 | 22 | 23 | 24 | 25 | 26 | 27 | 28 | 29 | 30 | 31 | 32 | 33 | 34 | 35 | 36 | 37 | 38 | 39 | 40 |
| 41 | 42 | 43 | 44 | 45 | 46 | 47 | 48 | 49 | 50 | 51 | 52 | 53 | 54 | 55 | 56 | 57 | 58 | 59 | 60 |
| 61 | 62 | 63 | 64 | 65 | 66 | 67 | 68 | 69 | 70 | 71 | 72 | 73 | 74 | 75 | 76 | 77 | 78 | 79 | 80 |
| 81 | 82 | 83 | 84 | 85 | 86 | 87 | 88 | 89 | 90 | 91 | 92 | 93 | 94 | 95 | 96 | 97 | 98 | 99 | 100 |
| 101 | 102 | 103 | 104 | 105 | 106 | 107 | 108 | 109 | 110 | 111 | 112 | 113 | 114 | 115 | 116 | 117 | 118 | 119 | 120 |
| 121 | 122 | 123 | 124 | 125 | 126 | 127 | 128 | 129 | 130 | 131 | 132 | 133 | 134 | 135 | 136 | 137 | 138 | 139 | 140 |
| 141 | 142 | 143 | 144 | 145 | 146 | 147 | 148 | 149 | 150 | 151 | 152 | 153 | 154 | 155 |
 Passage Reading
Verbal Logic
Non Verbal Logic
Numerical Logic
Data Interpretation
Reasoning
Analytical Ability
Basic Numeracy
About Us
Contact
Privacy Policy
Major Tests
FAQ
Passage Reading
Verbal Logic
Non Verbal Logic
Numerical Logic
Data Interpretation
Reasoning
Analytical Ability
Basic Numeracy
About Us
Contact
Privacy Policy
Major Tests
FAQ