1. Passage Reading
2. Verbal Logic
3. Non Verbal Logic
4. Numerical Logic
5. Data Interpretation
6. Reasoning
7. Analytical Ability
8. Quantitative Aptitude
(a) 50%
| |
(b) 62.5%
| |
(c) 75%
| |
(d) 80%
|
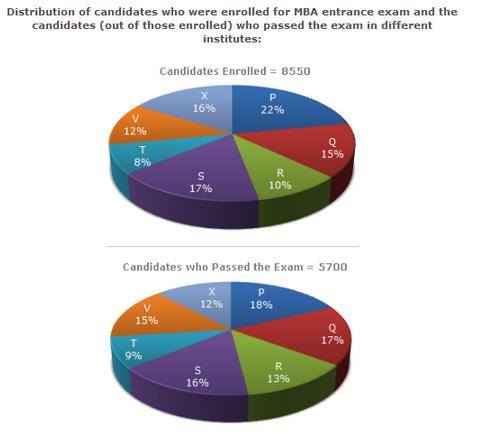
473. Which institute has the highest percentage of candidates passed to the candidates enrolled?
(a) Q
| |
(b) R
| |
(c) V
| |
(d) T
|
474. The number of candidates passed from institutes S and P together exceeds the number of candidates enrolled from institutes T and R together by
(a) 228
| |
(b) 279
| |
(c) 399
| |
(d) 407
|
475. What is the percentage of candidates passed to the candidates enrolled for institutes Q and R together?
(a) 68%
| |
(b) 80%
| |
(c) 74%
| |
(d) 65%
|
476. What is the ratio of candidates passed to the candidates enrolled from institute P?
(a) 9 : 11
| |
(b) 14 : 17
| |
(c) 6 : 11
| |
(d) 9 : 17
|
TOTAL
Detailed Solution| 1 | 2 | 3 | 4 | 5 | 6 | 7 | 8 | 9 | 10 | 11 | 12 | 13 | 14 | 15 | 16 | 17 | 18 | 19 | 20 |
| 21 | 22 | 23 | 24 | 25 | 26 | 27 | 28 | 29 | 30 | 31 | 32 | 33 | 34 | 35 | 36 | 37 | 38 | 39 | 40 |
| 41 | 42 | 43 | 44 | 45 | 46 | 47 | 48 | 49 | 50 | 51 | 52 | 53 | 54 | 55 | 56 | 57 | 58 | 59 | 60 |
| 61 | 62 | 63 | 64 | 65 | 66 | 67 | 68 | 69 | 70 | 71 | 72 | 73 | 74 | 75 | 76 | 77 | 78 | 79 | 80 |
| 81 | 82 | 83 | 84 | 85 | 86 | 87 | 88 | 89 | 90 | 91 | 92 | 93 | 94 | 95 | 96 | 97 | 98 | 99 | 100 |
| 101 | 102 | 103 | 104 | 105 | 106 | 107 | 108 | 109 | 110 | 111 | 112 | 113 | 114 | 115 | 116 | 117 | 118 | 119 | 120 |
| 121 | 122 | 123 | 124 | 125 | 126 | 127 | 128 | 129 | 130 | 131 | 132 | 133 | 134 | 135 | 136 | 137 | 138 | 139 | 140 |
| 141 | 142 | 143 | 144 | 145 | 146 | 147 | 148 | 149 | 150 | 151 | 152 | 153 | 154 | 155 |
 Passage Reading
Verbal Logic
Non Verbal Logic
Numerical Logic
Data Interpretation
Reasoning
Analytical Ability
Basic Numeracy
About Us
Contact
Privacy Policy
Major Tests
FAQ
Passage Reading
Verbal Logic
Non Verbal Logic
Numerical Logic
Data Interpretation
Reasoning
Analytical Ability
Basic Numeracy
About Us
Contact
Privacy Policy
Major Tests
FAQ