1. Passage Reading
2. Verbal Logic
3. Non Verbal Logic
4. Numerical Logic
5. Data Interpretation
6. Reasoning
7. Analytical Ability
8. Quantitative Aptitude
(a) 25%
| |
(b) 27.5%
| |
(c) 28.5%
| |
(d) 31.5%
|
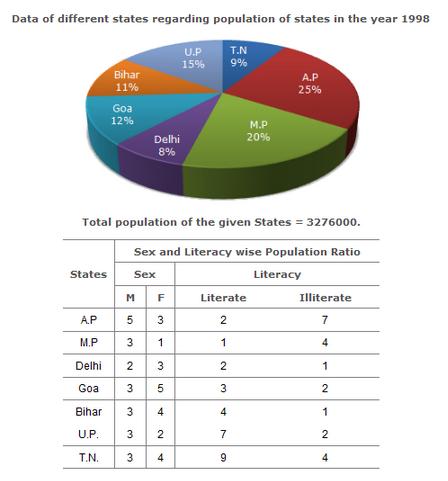
492. What was the total number of illiterate people in A.P. and M.P. in 1998?
(a) 876040
| |
(b) 932170
| |
(c) 981550
| |
(d) 1161160
|
493. What is the ratio of the number of females in T.N. to the number of females in Delhi?
(a) 7 : 5
| |
(b) 9 : 7
| |
(c) 13 : 11
| |
(d) 15 : 14
|
494. What was the number of males in U.P. in the year 1998?
(a) 254650
| |
(b) 294840
| |
(c) 321470
| |
(d) 341200
|
495. If in the year 1998, there was an increase of 10% in the population of U.P. and 12% in the population of M.P. compared to the previous year, then what was the ratio of populations of U.P. and M.P. in 1997?
(a) 42 : 55
| |
(b) 48 : 55
| |
(c) 7 : 11
| |
(d) 4 : 5
|
TOTAL
Detailed Solution| 1 | 2 | 3 | 4 | 5 | 6 | 7 | 8 | 9 | 10 | 11 | 12 | 13 | 14 | 15 | 16 | 17 | 18 | 19 | 20 |
| 21 | 22 | 23 | 24 | 25 | 26 | 27 | 28 | 29 | 30 | 31 | 32 | 33 | 34 | 35 | 36 | 37 | 38 | 39 | 40 |
| 41 | 42 | 43 | 44 | 45 | 46 | 47 | 48 | 49 | 50 | 51 | 52 | 53 | 54 | 55 | 56 | 57 | 58 | 59 | 60 |
| 61 | 62 | 63 | 64 | 65 | 66 | 67 | 68 | 69 | 70 | 71 | 72 | 73 | 74 | 75 | 76 | 77 | 78 | 79 | 80 |
| 81 | 82 | 83 | 84 | 85 | 86 | 87 | 88 | 89 | 90 | 91 | 92 | 93 | 94 | 95 | 96 | 97 | 98 | 99 | 100 |
| 101 | 102 | 103 | 104 | 105 | 106 | 107 | 108 | 109 | 110 | 111 | 112 | 113 | 114 | 115 | 116 | 117 | 118 | 119 | 120 |
| 121 | 122 | 123 | 124 | 125 | 126 | 127 | 128 | 129 | 130 | 131 | 132 | 133 | 134 | 135 | 136 | 137 | 138 | 139 | 140 |
| 141 | 142 | 143 | 144 | 145 | 146 | 147 | 148 | 149 | 150 | 151 | 152 | 153 | 154 | 155 |
 Passage Reading
Verbal Logic
Non Verbal Logic
Numerical Logic
Data Interpretation
Reasoning
Analytical Ability
Basic Numeracy
About Us
Contact
Privacy Policy
Major Tests
FAQ
Passage Reading
Verbal Logic
Non Verbal Logic
Numerical Logic
Data Interpretation
Reasoning
Analytical Ability
Basic Numeracy
About Us
Contact
Privacy Policy
Major Tests
FAQ