1. Passage Reading
2. Verbal Logic
3. Non Verbal Logic
4. Numerical Logic
5. Data Interpretation
6. Reasoning
7. Analytical Ability
8. Quantitative Aptitude
(a) 5.50
| |
(b) 5.36
| |
(c) 5.64
| |
(d) 5.75
|
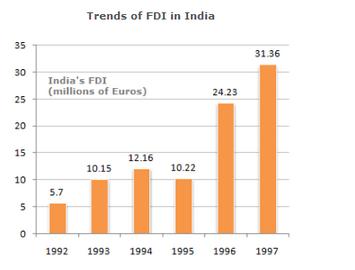
487. What was absolute difference in the FDI to India in between 1996 and 1997 ?
(a) 7.29
| |
(b) 7.13
| |
(c) 8.13
| |
(d) None of these
|
488. If India FDI from OPEC countries was proportionately the same in 1992 and 1997 as the total FDI from all over the world and if the FDI in 1992 from the OPEC countries was Euro 2 million. What was the amount of FDI from the OPEC countries in 1997 ?
(a) 11
| |
(b) 10.72
| |
(c) 11.28
| |
(d) 11.5
|
489. Which year exhibited the highest growth in FDI in India over the period shown ?
(a) 1993
| |
(b) 1994
| |
(c) 1995
| |
(d) 1996
|
490. What was India's total FDI for the period shown in the figure ?
(a) 93.82
| |
(b) 93.22
| |
(c) 93.19
| |
(d) None of these
|
TOTAL
Detailed Solution| 1 | 2 | 3 | 4 | 5 | 6 | 7 | 8 | 9 | 10 | 11 | 12 | 13 | 14 | 15 | 16 | 17 | 18 | 19 | 20 |
| 21 | 22 | 23 | 24 | 25 | 26 | 27 | 28 | 29 | 30 | 31 | 32 | 33 | 34 | 35 | 36 | 37 | 38 | 39 | 40 |
| 41 | 42 | 43 | 44 | 45 | 46 | 47 | 48 | 49 | 50 | 51 | 52 | 53 | 54 | 55 | 56 | 57 | 58 | 59 | 60 |
| 61 | 62 | 63 | 64 | 65 | 66 | 67 | 68 | 69 | 70 | 71 | 72 | 73 | 74 | 75 | 76 | 77 | 78 | 79 | 80 |
| 81 | 82 | 83 | 84 | 85 | 86 | 87 | 88 | 89 | 90 | 91 | 92 | 93 | 94 | 95 | 96 | 97 | 98 | 99 | 100 |
| 101 | 102 | 103 | 104 | 105 | 106 | 107 | 108 | 109 | 110 | 111 | 112 | 113 | 114 | 115 | 116 | 117 | 118 | 119 | 120 |
| 121 | 122 | 123 | 124 | 125 | 126 | 127 | 128 | 129 | 130 | 131 | 132 | 133 | 134 | 135 | 136 | 137 | 138 | 139 | 140 |
| 141 | 142 | 143 | 144 | 145 | 146 | 147 | 148 | 149 | 150 | 151 | 152 | 153 | 154 | 155 |
 Passage Reading
Verbal Logic
Non Verbal Logic
Numerical Logic
Data Interpretation
Reasoning
Analytical Ability
Basic Numeracy
About Us
Contact
Privacy Policy
Major Tests
FAQ
Passage Reading
Verbal Logic
Non Verbal Logic
Numerical Logic
Data Interpretation
Reasoning
Analytical Ability
Basic Numeracy
About Us
Contact
Privacy Policy
Major Tests
FAQ