Data Interpretation
(a) 82%
| |
(b) 41%
| |
(c) 21%
| |
(d) 18%
|
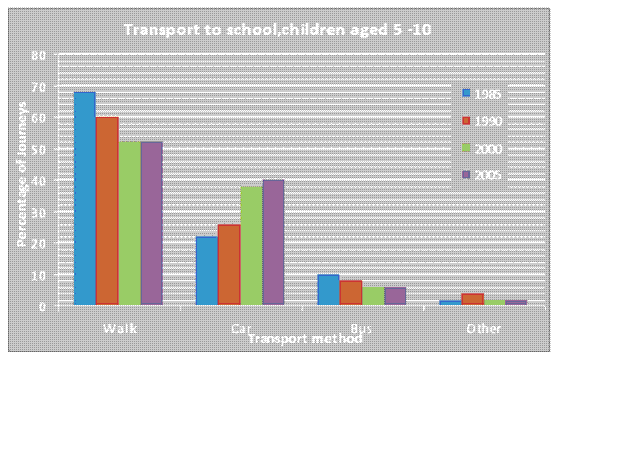
178. If the percentage of children aged 5 – 10 walking to school over the 20 year period 2005 to 2025 drops by the same amount as it did between 1985 and 2005, what percentage of children will walk to school in 2025?
(a) 36%
| |
(b) 41%
| |
(c) 50%
| |
(d) 51%
|
179. The number of primary school journeys made in 2005 was 4.5 million. Approximately how many of these journeys were made by bus?
(a) 450,000
| |
(b) 405,000
| |
(c) 315,000
| |
(d) 270,000
|
TOTAL
Detailed Solution

To get Complete E Book in Pdf format with detailed solution Please visit:

| 1 | 2 | 3 | 4 | 5 | 6 | 7 | 8 | 9 | 10 | 11 | 12 | 13 | 14 | 15 | 16 | 17 | 18 | 19 | 20 |
| 21 | 22 | 23 | 24 | 25 | 26 | 27 | 28 | 29 | 30 | 31 | 32 | 33 | 34 | 35 | 36 | 37 | 38 | 39 | 40 |
| 41 | 42 | 43 | 44 | 45 | 46 | 47 | 48 | 49 | 50 | 51 | 52 | 53 | 54 | 55 | 56 | 57 | 58 | 59 | 60 |
| 61 | 62 | 63 | 64 | 65 | 66 | 67 | 68 | 69 | 70 | 71 | 72 | 73 | 74 | 75 | 76 | 77 | 78 | 79 | 80 |
| 81 | 82 | 83 | 84 | 85 | 86 | 87 | 88 | 89 | 90 | 91 | 92 | 93 | 94 | 95 | 96 | 97 | 98 | 99 | 100 |
| 101 | 102 | 103 | 104 | 105 | 106 | 107 | 108 | 109 | 110 | 111 | 112 | 113 | 114 | 115 | 116 | 117 | 118 | 119 | 120 |
| 121 | 122 | 123 | 124 | 125 | 126 | 127 | 128 | 129 | 130 | 131 | 132 | 133 | 134 | 135 | 136 | 137 | 138 | 139 | 140 |
| 141 | 142 | 143 | 144 | 145 | 146 | 147 | 148 | 149 | 150 | 151 | 152 | 153 | 154 | 155 |
 Passage Reading
 Verbal Logic
 Non Verbal Logic
 Numerical Logic
 Data Interpretation
 Reasoning
 Analytical Ability
 Basic Numeracy
 About Us
 Contact
 Privacy Policy
 Major Tests
 FAQ
FAQ

